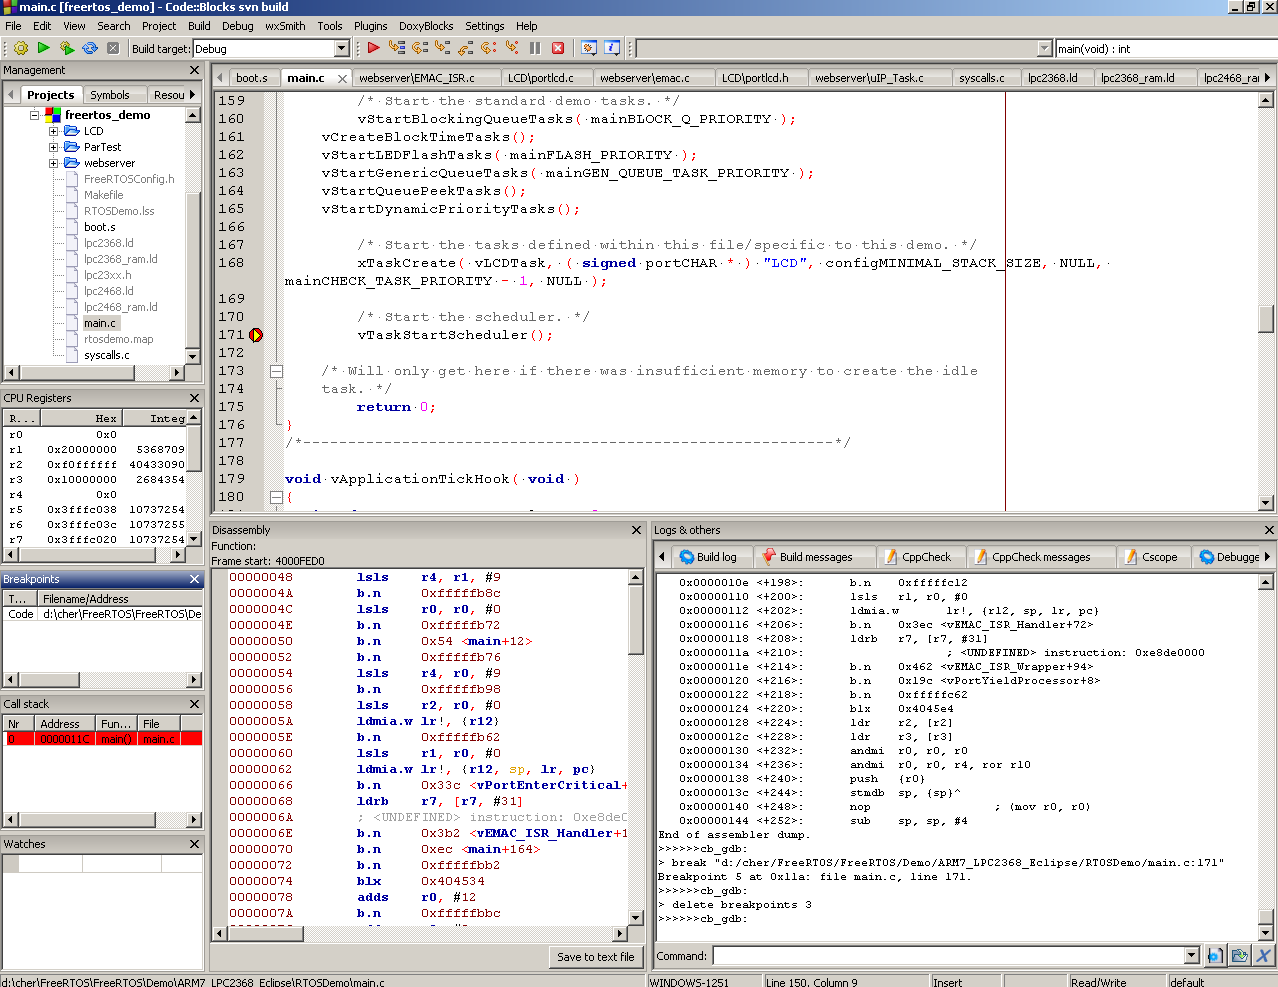
|
CMSIS2000
0.0.7
|
|
CMSIS2000
0.0.7
|
You need some tools for debugging:
Debugging scheme is simple:
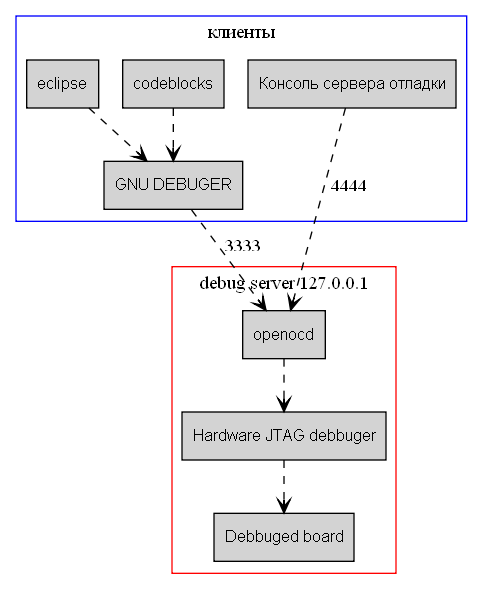
Next sections describe this scheme from bottom to top.
At first all electronic components on board must be connected. You should remember to some electric rules of this process:
Hw debugger is connected by JTAG connector. Next you should connect Debugger with USB cable to PC, and at last you should give power on board.
At the OS PC point of view debugger is a COM port USB device. OS drivers implements com port interface.There is two program implementations of such drivers:
A new usb device must appeared then you connect hw debugger to PC. Next you should run debug server.
OpenOCD is a debug server. Server waits TCP/IP connection from gdb on 3333 port, and telnet connection on 4444 port (see figure). Also debug server can be run in other modes (com порт, stdio). This modes are not described here. Server commands can be sent from gdb, all this commands starts from monitor word. Also commands can be sent from telnet debug console.
In majority there is no need to work with OpenOCD server, all operations can be done from gdb. But sometimes (CodeBlocks has no reset button) it is useful to send and look some messages to/from OpenOCD that can appeared if there is power reset or something hardware else.
OpenOCD is running by command :
where,
openOCD running example:
>openocd -d2 -f interface/olimex-arm-usb-ocd.cfg -f target/lpc2478.cfg
Open On-Chip Debugger 0.4.0 (2010-02-22-19:05)
Licensed under GNU GPL v2
For bug reports, read
        http://openocd.berlios.de/doc/doxygen/bugs.html
debug_level: 2
jtag_nsrst_delay: 100
jtag_ntrst_delay: 100
trst_and_srst srst_pulls_trst srst_gates_jtag trst_push_pull srst_open_drain
RCLK - adaptive
Info : RCLK (adaptive clock speed) not supported - fallback to 500 kHz
Info : JTAG tap: lpc2478.cpu tap/device found: 0x4f1f0f0f (mfg: 0x787, part: 0xf
1f0, ver: 0x4)
Info : Embedded ICE version 7
Error: EmbeddedICE v7 handling might be broken
Info : lpc2478.cpu: hardware has 2 breakpoint/watchpoint units
openOCD waits telnet connection on 4444 port number by default. If you connect to port with some telnet client you can give command to server.
Putty or Realterm is suitable for this.
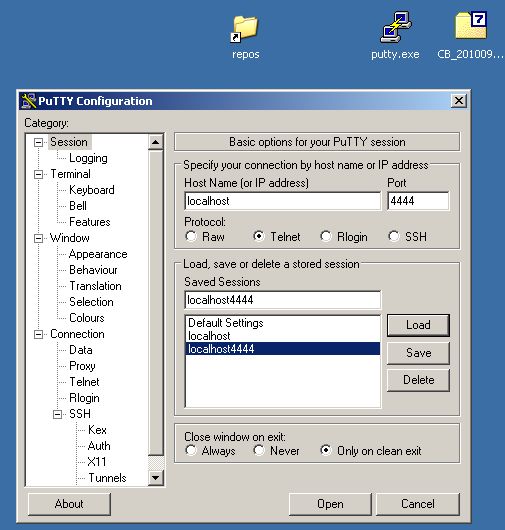
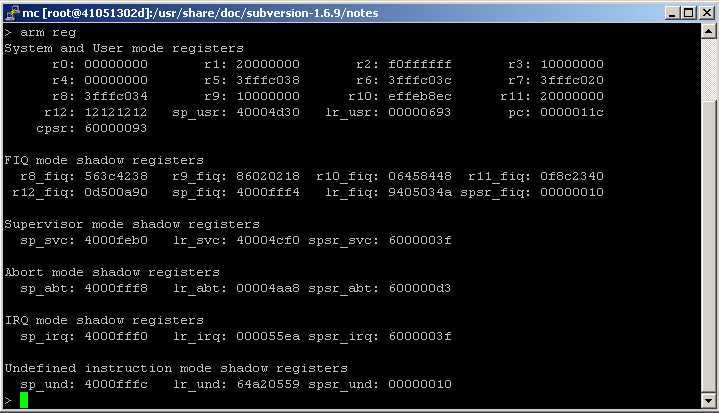
all openOCD commands can be viewed by help command in debug console
Examples:
> help speed
jtag_khz [khz]
      With an argument, change to the specified maximum jtag speed.  Pass 0
      to require adaptive clocking. With or without argument, display
      current setting. (command valid any time)
jtag_rclk [fallback_speed_khz]
      With an argument, change to to use adaptive clocking if possible;
      else to use the fallback speed.  With or without argument, display
      current setting. (command valid any time)
If you want to go some codeblock you can put its first instruction address to pc manually. You should write reg pc 0x40000000 in console or monitor reg pc 0x40000000 in CodeBlocks gdb console.
Application debugging in SDRAM is the most fast, but it can not work from the first time because SDRAM controller are not activated. SDRAM activating can be done with some SDRAM application that stored in FLASH. U-boot or SDRAM example from NXP will help you. Next you connect hw debugger, start you program project with CodeBlocks and write next strings in console
monitor reg pc 0
Next you press Start/Continue and wait a couple of seconds wile FLASH application activates SDRAM chip. Next you try again load you application to SDRAM by command
load
Now you program in SDRAM. Then you should run program with command
monitor reg pc your program ADRESS in SDRAM
Дальнешая актвизация SDRAM не требуется, можно сколько угодно раз загружать и останваливать процесс отладки. Работа с RAM позволяет устанавливать любое число точек останова так как они программные, в отличие от аппаратных точек останова во FLASH.
More slow – more stable! You should play with next OpenOCD settings for more stability.
First you should setup CodeBlocks version 10.2. It is recommended to choose all plugins in setup process this will avoid some CodeBlocks warnings. Next you should setup last svn version in the same directory rewriting 10.2 version. For example CB_20100912_rev6583_DEBUGGER_BRANCH_win32.7z file must be extracted in the same directory. There is automatic build of CodeBlocks Debug version every mounth. It can be found in CodeBlocks forum.
It is nessesary to check two settings in CodeBlocks in Settings-> Compiler and Debugger -> Debugger Settings menu.
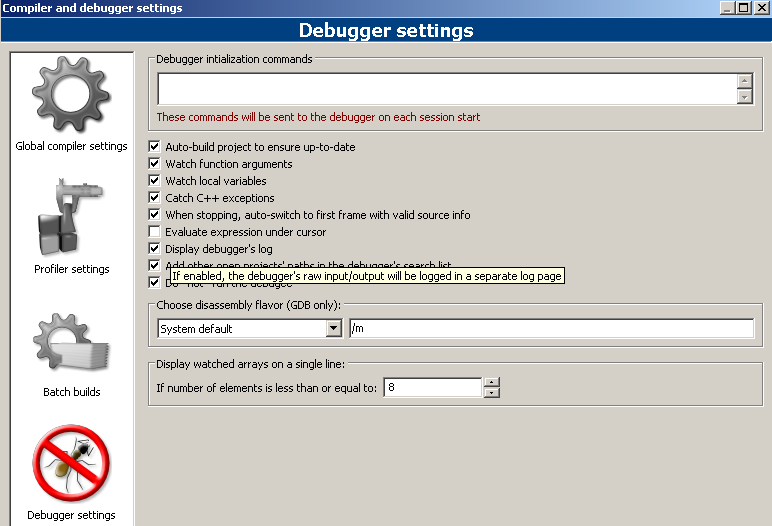
If CodeBlocks project is configured as ARM project then GNU DEBUGER will be executed automatically.
GDB is running by CodeBlocks. The main running parameters are sent to GDB by CodeBlocks. Main parameters are
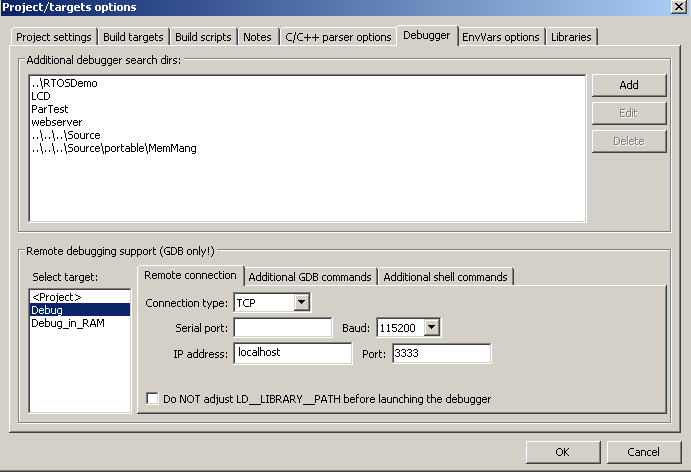
Additional GDB commands: Here you can set additional commands that connected to debug and board specific. You should probably place commands in .gdbinit file and write ``source .gdbinit'' to ``After Connection'' field.
This is RAM debug parameters for GDB and LPC
Also you can put content of .gdbinit file in ``After Connection'' directly as it shown on figure.

All parameters that starts with monitor are sent to debug server . This mean that command monitor reset init will be sent as reset init
If you want to run debugging with GDB you should do this things
After opening project you should press Debug\Start and Continue, this will run compile and debug process.
